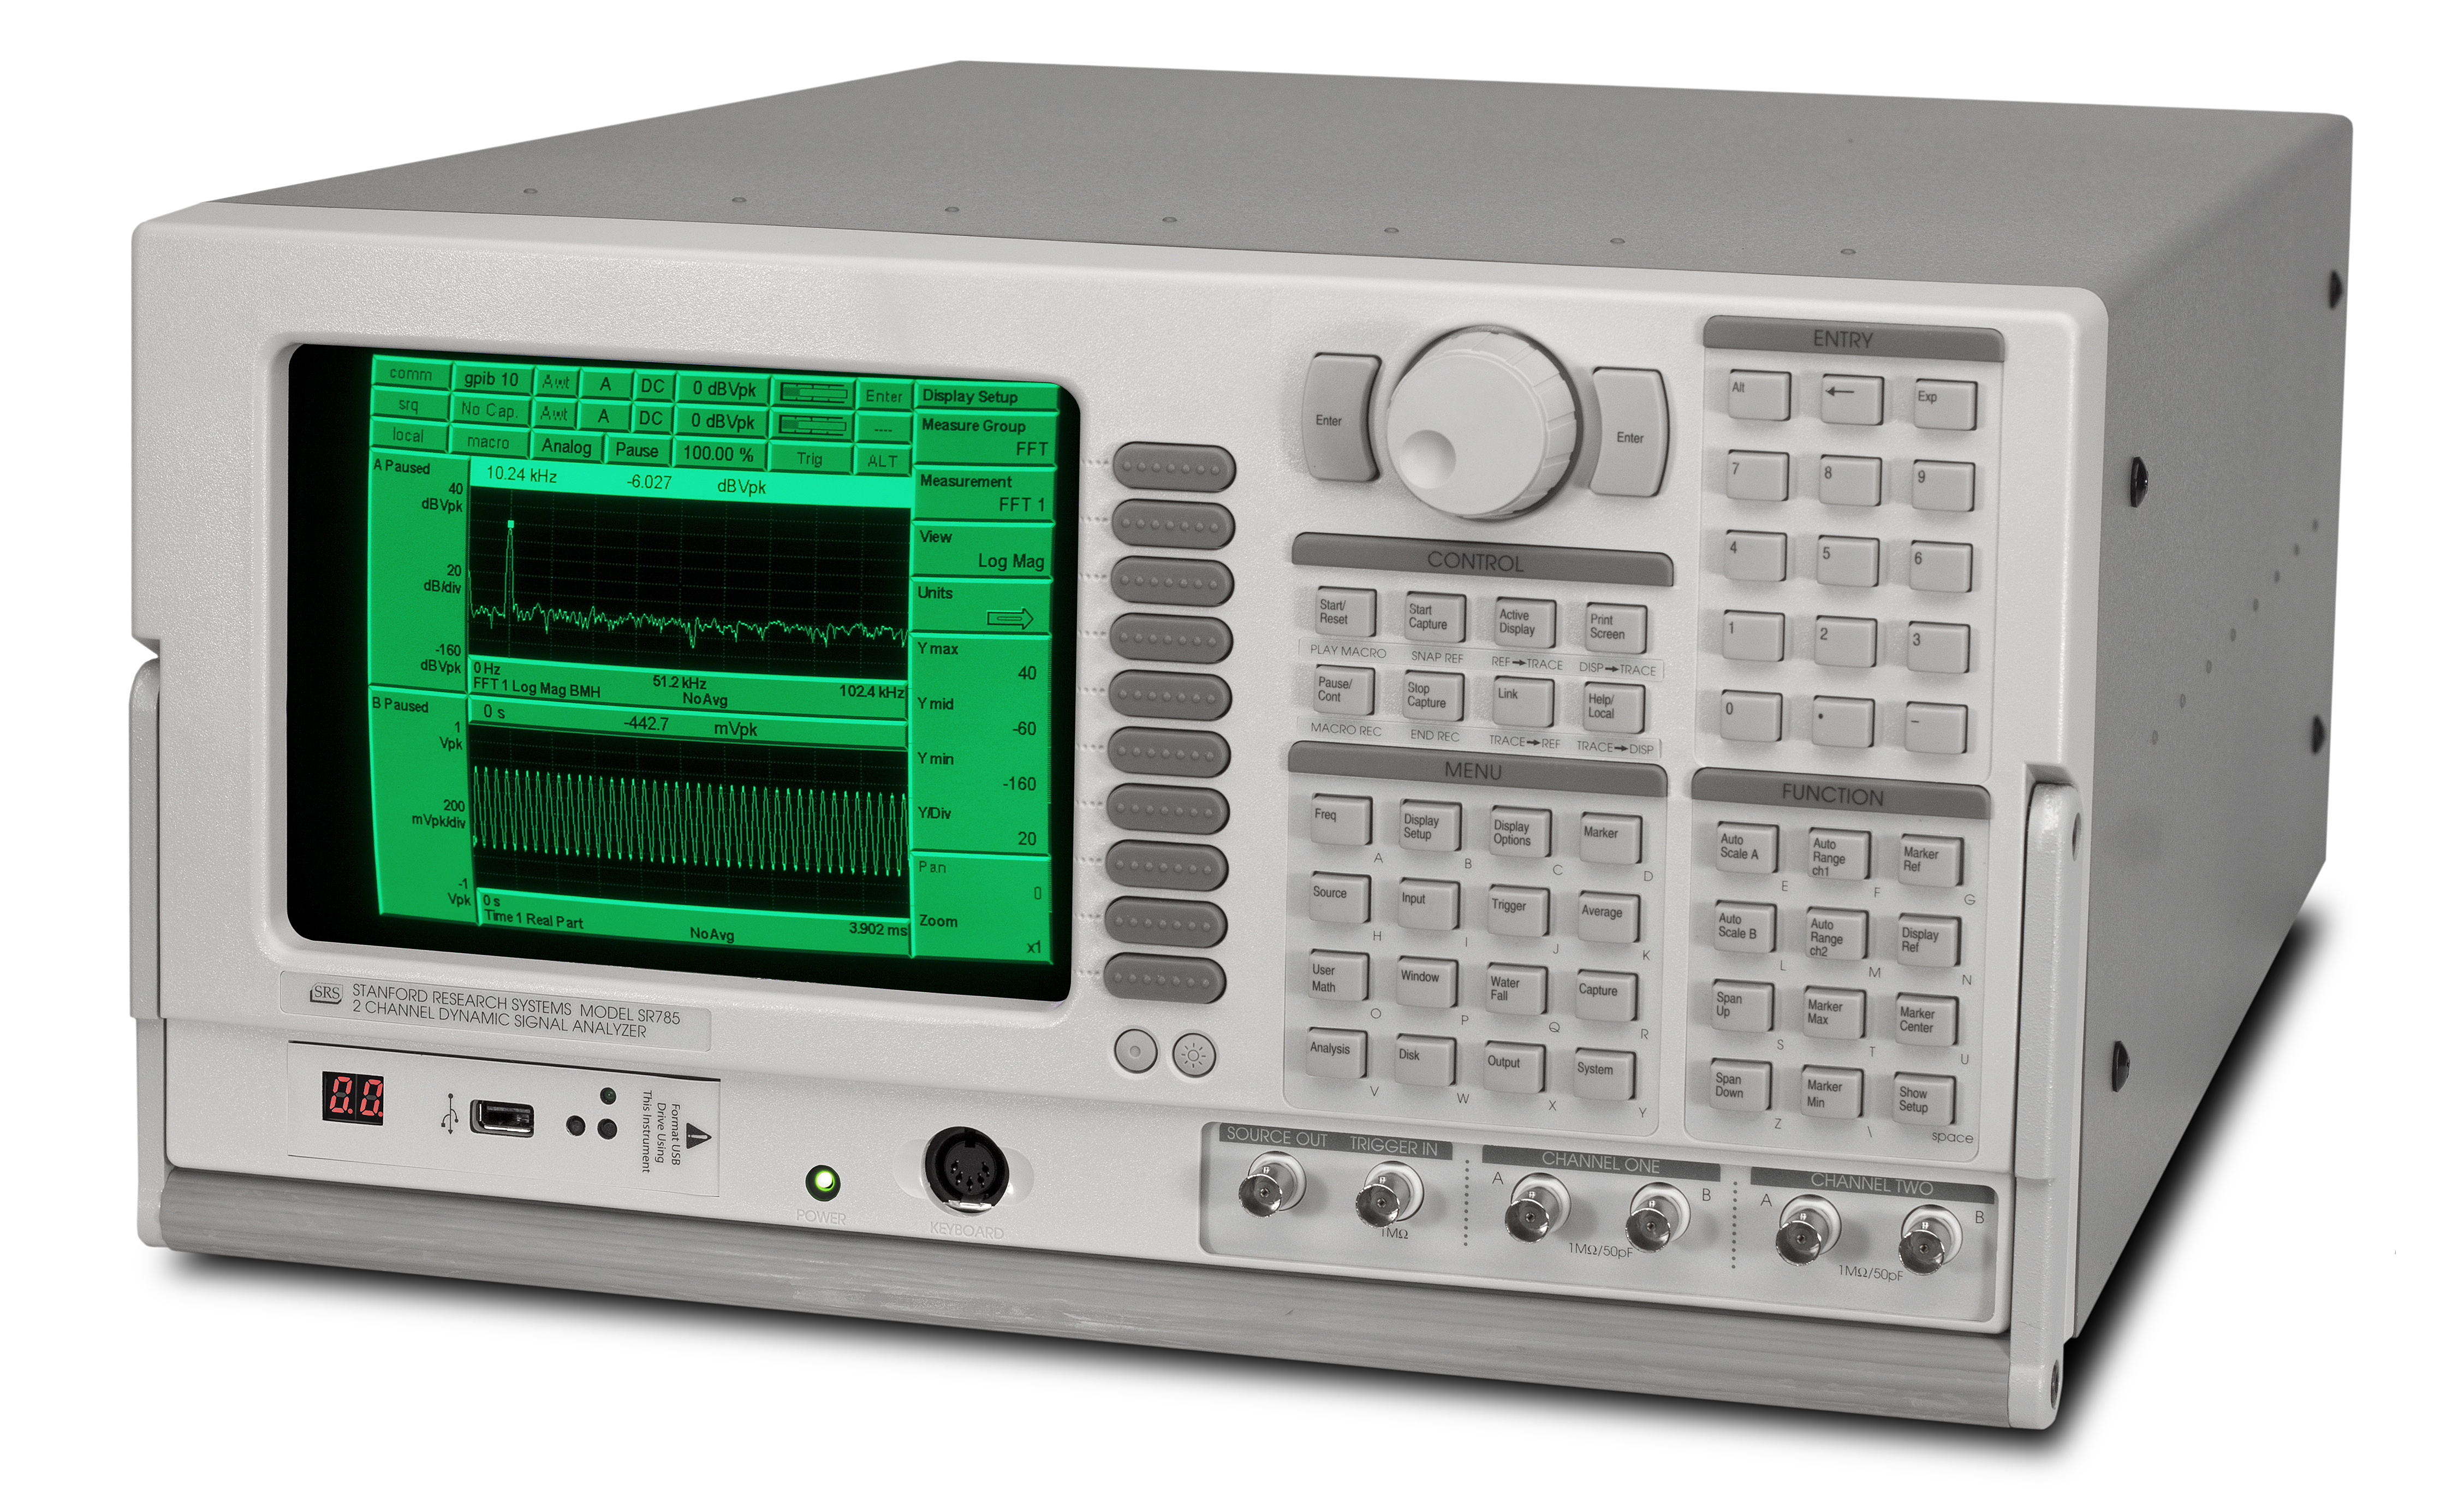
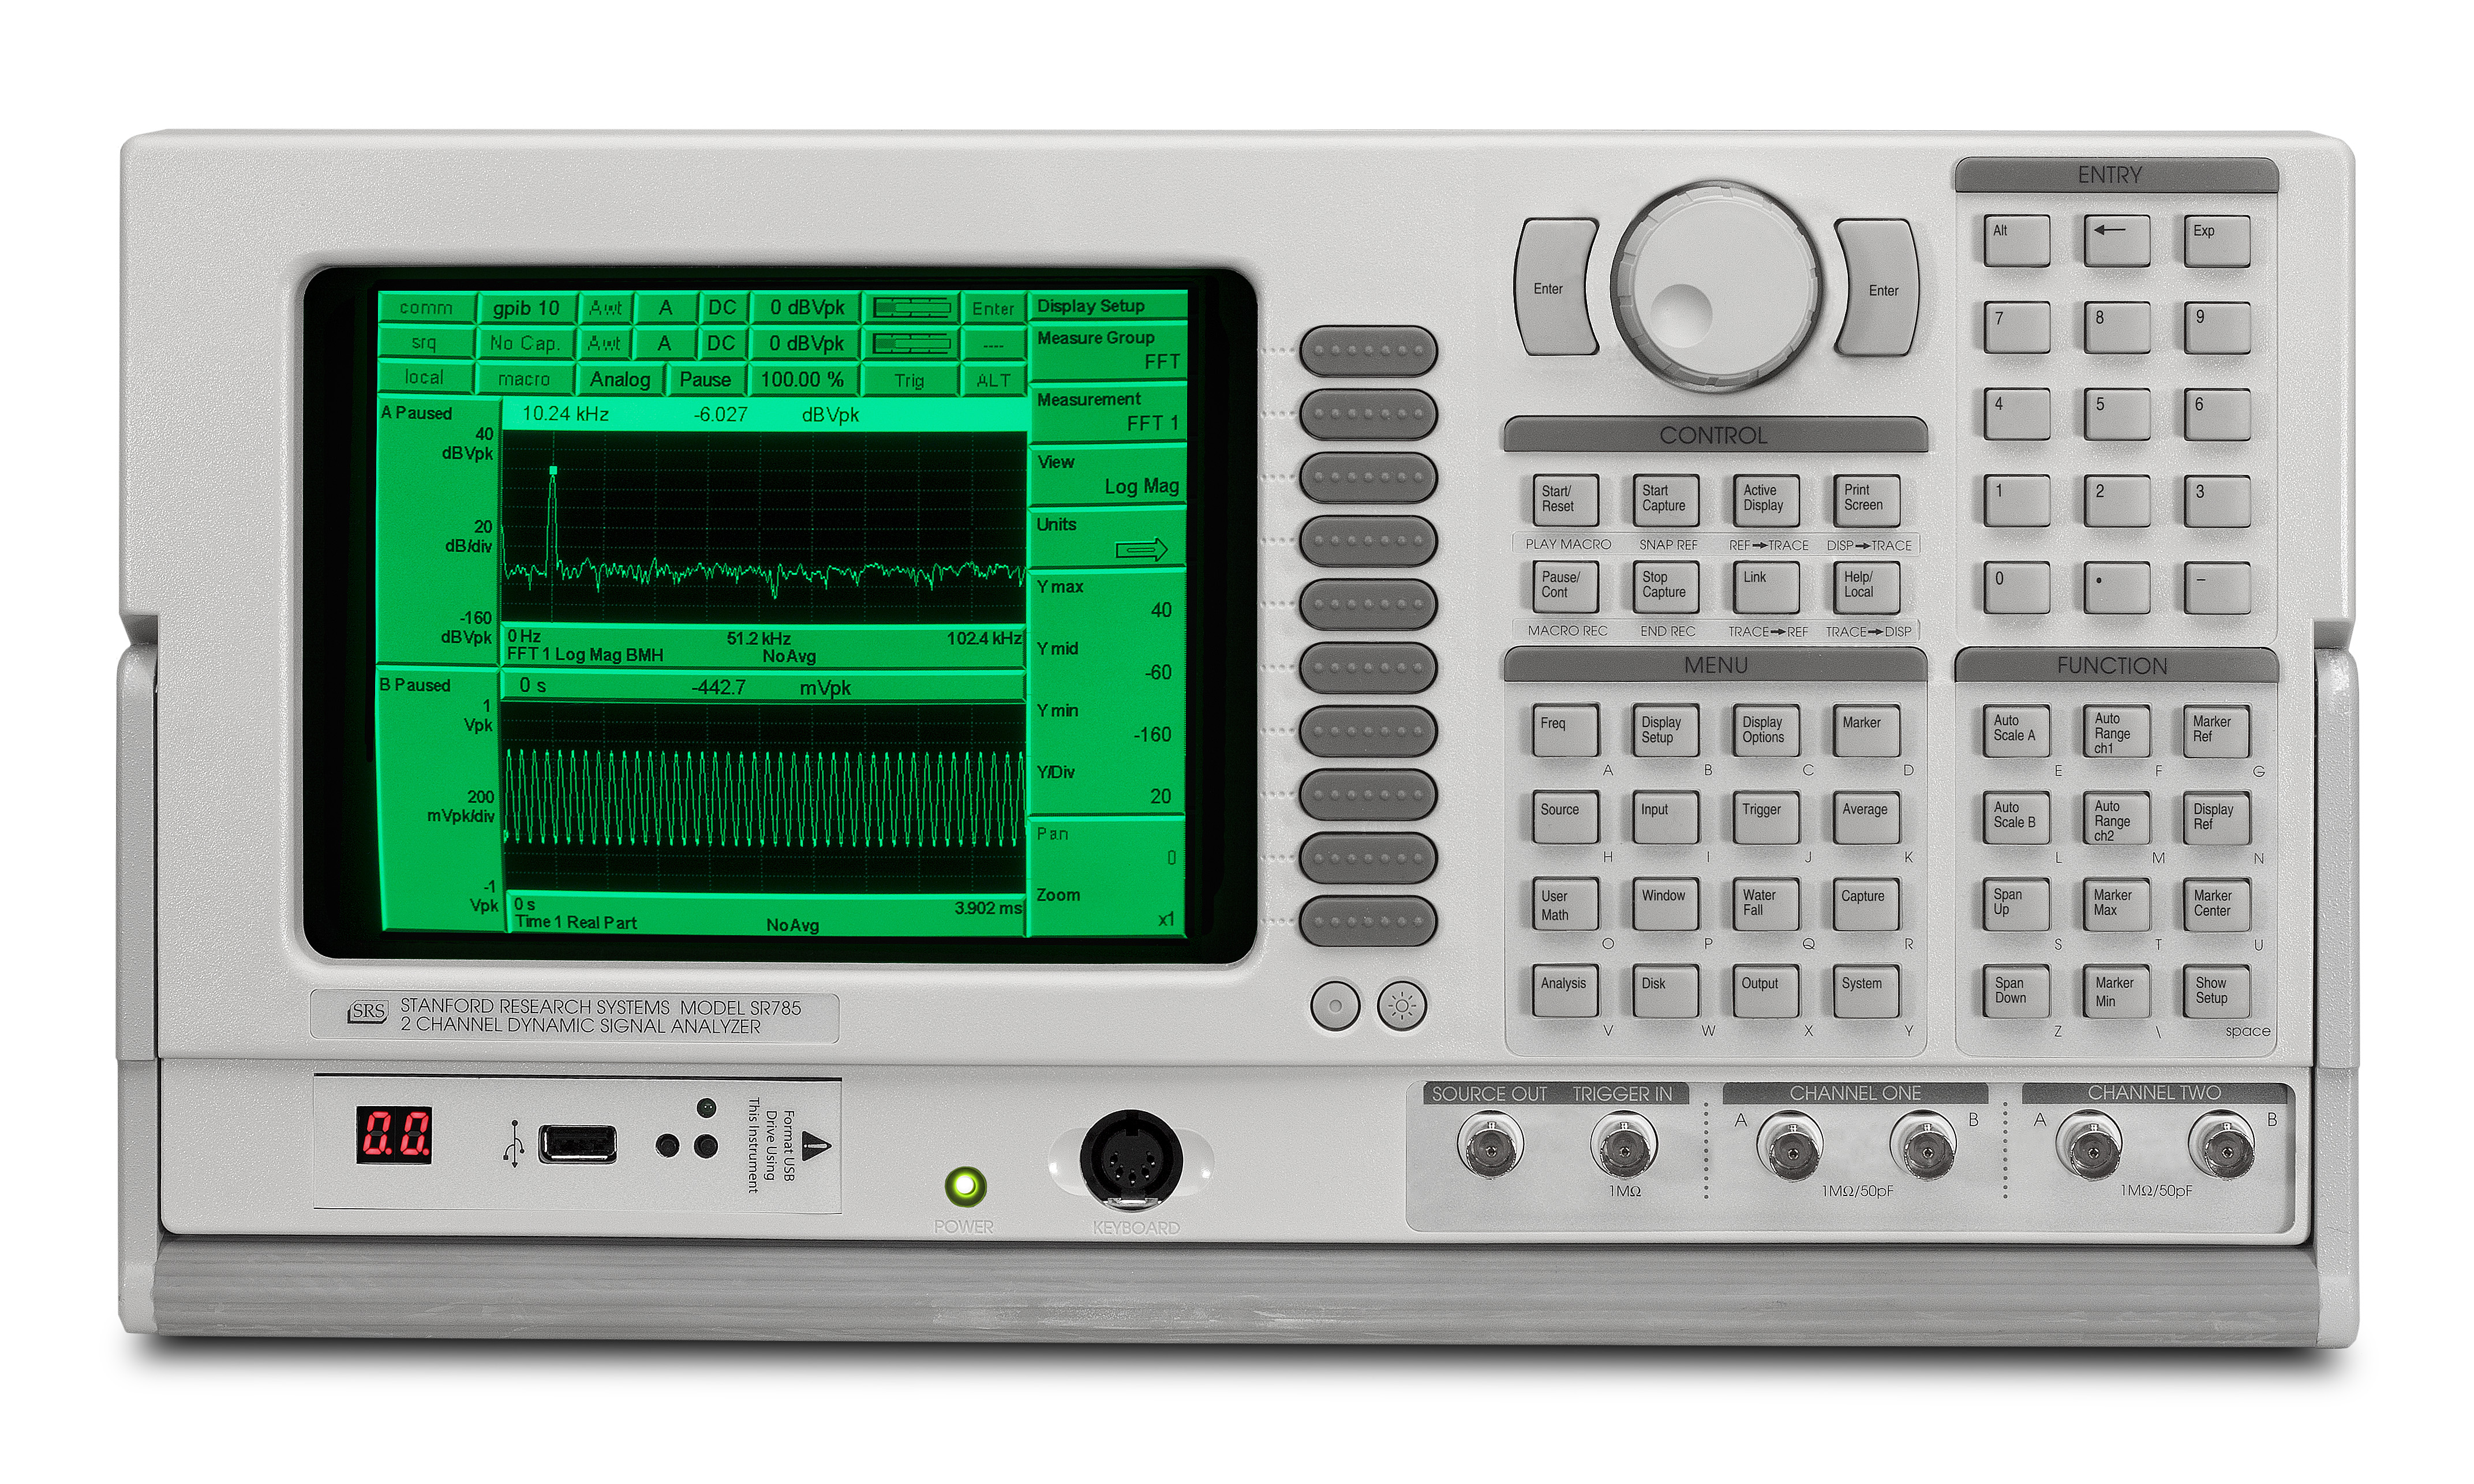
The SR785 Two-Channel Dynamic Signal Analyzer is a precision, full-featured signal analyzer that offers state-of-the-art performance at a price that's less than half that of competitive analyzers. Building on its predecessor, the SR780, the SR785 incorporates new firmware and hardware that make it the ideal instrument for analyzing both mechanical and electrical systems. For measurements involving servo systems, control systems, acoustics, vibration testing, modal analysis, or machinery diagnostics, the SR785 has the features and specifications to get the job done.
Standard measurement groups include FFT, order tracking, octave, swept-sine, correlation, time capture, and time/histogram. The SR785 brings the power of several instruments to your application: a spectrum analyzer, network analyzer, vibration analyzer, octave analyzer and oscilloscope.
A unique measurement architecture allows the SR785 to function as a typical dual-channel analyzer with measurements like cross spectrum, frequency response, coherence, etc. Alternatively, the instrument can be configured so that each input channel functions as a single-channel analyzer with its own span, center frequency, resolution and averaging. This allows you to view a wide-band spectrum and simultaneously zoom in on spectral details. The same advanced architecture provides storage of all measurement building blocks and averaging modes. Vector averaged, rms averaged, unaveraged, and peak hold versions of all measurements are simultaneously acquired and can be displayed without
Averaging
The SR785 comes equipped with a wide selection of averaging techniques to improve your
Because the SR785 is so fast, there's no need for a separate "fast averaging" mode. For instance, in a full-span FFT measurement with a 4 ms time record, 1000 averages take exactly 4 seconds, during which the SR785 still operates at its maximum display rate.
For impact testing, the average preview feature allows each time record or spectrum to be accepted or rejected before adding it to the measurement.
Order Tracking
Order tracking is used to evaluate the behavior of rotating machinery. Measurement data is displayed as a function of multiples of the shaft frequency (orders), rather than absolute frequency. Combined with a waterfall plot, the SR785 provides a complete history or "order map" of your data as a function of time or rpm. Using the slice feature, the amplitude profile of specific orders in the map can be analyzed.
In tracked order mode, the intensity of individual orders vs rpm is measured. Unlike other analyzers, there's no need to track a limited number of orders to ensure full speed measurements. The SR785's speed allows simultaneous tracking of up to 400 orders.
Run-up and run-down measurements are available in both polar and magnitude/phase formats. RPM profiling is provided to monitor variations of rpm as a function of time. A complete selection of time and rpm triggering modes is included, allowing you to make virtually any rotating machinery measurement.
Octave Analysis
Real-time 1/1, 1/3 and 1/12 octave analysis, at frequencies up to 40 kHz (single channel) or 20 kHz (two channel), is a standard feature of the SR785. Octave analysis is fully compliant with
Octave displays can be plotted as waterfalls with a fast 4 ms storage interval. Once data is stored in the waterfall buffer, the SR785 can display centile exceedance statistics for each 1/1, 1/3 or 1/12 octave band, as well as for Leq.
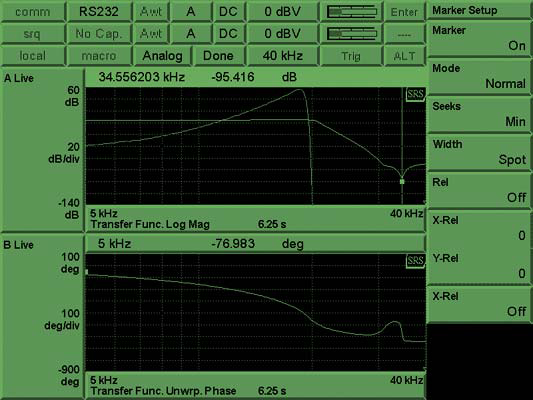
Swept-Sine Measurements
Swept-sine mode is ideal for signal analysis that involves high dynamic range or wide frequency spans. Gain is optimized at each point in the measurement, producing up to 145 dB of dynamic range. A frequency resolution of up to 2000 points is also provided.
Auto-resolution ensures the fastest possible sweeps and adjusts the frequency steps in the scan based on the DUT's response. Phase and amplitude changes that exceed user-defined thresholds are measured with high frequency resolution, while small changes are measured using wider frequency steps between points. A choice of linear sweeps with high resolution, or logarithmic sweeps with up to eight decades of frequency range, is provided.
Time/Histogram
The time/histogram measurement group is used to analyze
Time Capture
The SR785 comes with 8 Mbytes of memory (32 Mbytes optional). Analog waveforms can be captured at sampling rates of 262 kHz or any binary sub-multiple, allowing you to optimize sampling rate and storage for any application. For example, 8 Msamples of memory will capture 32 seconds of time domain data at the maximum 262 kHz sample rate, or about 9 hours of data at a 256 Hz sample rate. Once captured, any portion of the signal can be played back in any of the SR785's measurement groups except
Transducer Units
Automatic unit conversion makes translating transducer data easy. Enter your transducer conversion directly in V/EU, EU/V or dB (1V/EU). The SR785 will display the result in units of meters, inches, m/sec2, in/sec2, m/s, in/s, mil, g, kg, lbs., N, dynes, pascals or bars.
Source
The SR785 comes with six precision source types: low-distortion (-80 dBc) single or two-tone sine waves, white noise, pink noise, chirp, and arbitrary waveforms. The chirp and noise sources can be bursted to provide activity over a selected portion of the time record for FFT measurements, or to provide impulse noise for acoustic measurements.
Arbitrary waveform capability is standard with the SR785. Use the arbitrary source to playback a section of a captured waveform, play a selected FFT time record, or upload your own custom waveform from your computer.
User Math
Custom measurements can be created in each of the SR785's measurement groups using the math menu. Enter any equation involving rms averaged, vector averaged or unaveraged time or frequency data, stored files, constants, or a rich array of supplied operations including arithmetic functions, FFT, inverse FFT, jΩ, d/dΩ, exp, ln x and many others. All of the averaging modes are available as user math operands. Unlike many other analyzers, the SR785's measurement rate is virtually unaffected when user math is selected. For instance, the function
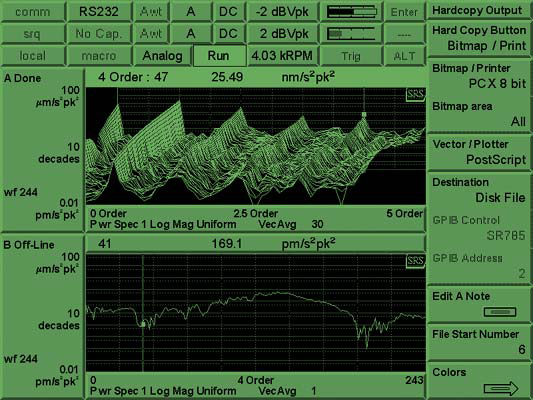
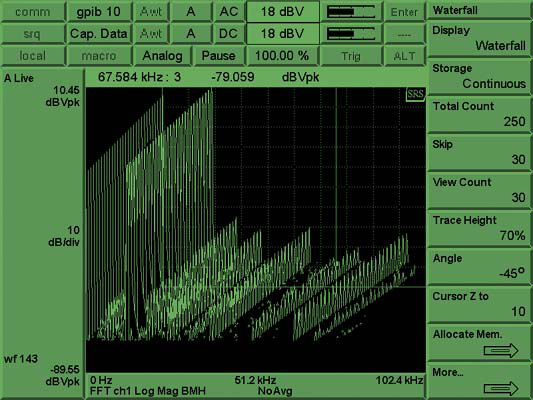
Waterfall
Waterfall plots are a convenient way of viewing a time history of your data. Each successive measurement record is plotted along the
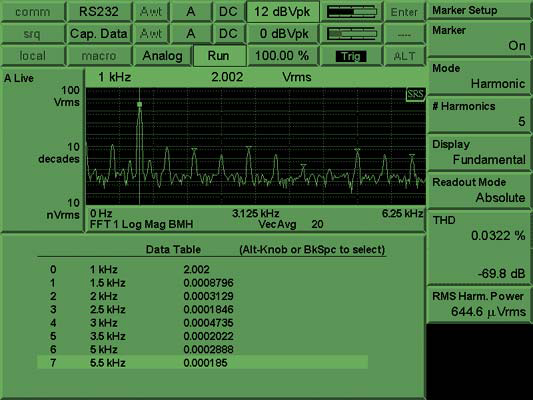
Analysis
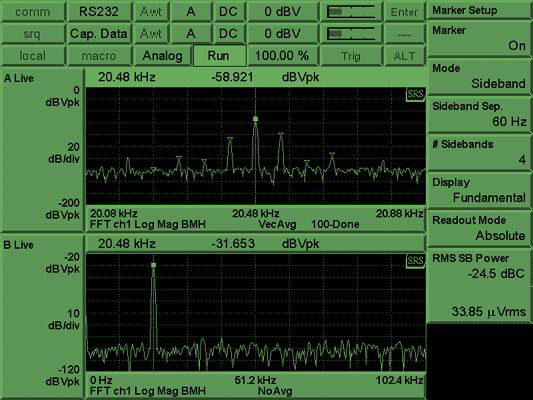
The SR785 includes a wide variety of built-in analysis features. Marker analysis lets you easily measure the power contained in harmonics, sidebands or within a given band of frequencies. Important information such as THD, THD+N, sideband power relative to a carrier, or total integrated power are calculated in real time and displayed on the screen. The front/back display feature allows you to display live data from both signal inputs on one graph. You can also simultaneously display saved traces and live data. The
Data tables are used to display up to 100 selected data points in tabular format. Limit tables allow you to define up to 100 upper and lower limit segments in each display for
Curve Fit and Synthesis
The SR785 has a
Output
The SR785's USB drive, computer interfaces (GPIB and
Data Conversion Utilities
The SR785 comes with a complete suite of data conversion utilities for both Windows and DOS operating systems. SR785 files can be converted to ASCII for use with spreadsheets, or Universal File Format (UFF) and HP SDF for use with modal analysis programs. SR785 files can also be converted to MAT file format for use with MATLAB. Conversion from external file types is also supported. Both HP SDF and SR780 files can be converted to SR785 format.
Instrument Modes
FFT, Time/Histogram, Correlation, Octave,
Frequency Domain Measurements
Frequency Response, Linear Spectrum, Cross Spectrum, Power Spectrum, Coherence, Power Spectral Density
Time Domain Measurements
Time Record,
Amplitude Domain Measurements
Histogram, PDF, CDF
FFT Resolution
100, 200, 400, 800 lines
Views
Linear Magnitude, Log Magnitude, dB Magnitude, Magnitude Squared, Real Part, Imaginary Part, Phase, Unwrapped Phase, Nichols, Nyquist, Polar
Units
V, V2, V2/Hz, V/√Hz, meters, meters/s, meters/s2, inches, inches/s, inches/s2, mils, g, kg, lbs., N, dynes, pascals, bars, SPL,
Displays
Single, Dual, Front/Back Overlay, Waterfall with Skew, Zoom and Pan, Grid On/Off
Marker Functions
Trace Marker, Dual-Trace Linked Marker, Absolute and Relative Marker, Peak Find, Harmonic Marker, Band and Sideband Marker, Waterfall Marker, Frequency Damping Marker
Averaging
RMS, Vector, Peak Hold, Linear, Exponential, Equal Confidence (Octave), Preview Time Record, Percent Overlap Averaging, Overload Reject
Triggering
Continuous, Internal, External (Analog or TTL), Source, Auto/Manual Arming, GPIB, RPM Step, Time Step, Pre/Post Trigger Delay
Source Outputs
Sine, Two-Tone, Swept-Sine, White/Pink Noise, Burst Noise, Chirp, Burst Chirp, and Arbitrary
Windows
Hanning, Blackman-Harris,
User Math
+, -, ×, /, Conjugate, Magnitude/Phase, Real/Imaginary, Sqrt, FFT, Inverse FFT, jΩ, Log, Exp,
Analysis
Harmonic, Band, Sideband, THD, THD+N, Limit Test with Pass/Fail, Data Table, Exceedance, Statistics, Curve Fit and Synthesis
Time Capture
Captures time data for later analysis (FFT or Octave). Up to 2 Msamples (8 Msamples optional) of data can be saved.
Storage
3.5", 1.44 Mbyte DOS formatted disk. Save data, setups and hard copy data.
Hard Copy and Interfaces
Print to Dot Matrix or PCL (LaserJet and DeskJet) printers. Plot to
Data Conversion Utility
Data, waterfall and capture files can be converted to ASCII. Data files can also be converted to Universal File Format, SDF format or MATLAB
DataViewer
Windows based graphics program for viewing SR785 files. Graphs can be pasted to the clipboard or saved in PCX, BMP or GIF.